


TL;DR the shorter the better, down to per-hour or even per-minute. And we're not just saying that because we can.
Ruby recently launched Dollar-Cost Averaging: The ability to make automatic purchases of your chosen asset at regular intervals, smoothing out the ups-and-downs of the market and reducing risk.
Many centralized platforms allow users to DCA every month, but Ruby is the only DEX that allows users to set a custom interval and invest trustlessly—all with zero gas fees! You can drip any amount of funds (even pennies at a time) into the market, however often you want, down to every hour.
But what's the best interval for DCAing? We've spent some time crunching the data, so you don't have to...

It's December 31, 2022, and you've decided to pull the trigger and get into bitcoin. It's a volatile asset and you want to control your risk, so you decide to dollar-cost average (DCA) in over time. But what interval should you select?
Since you've got nothing better to do this evening—just because the earth has completed another orbit of the sun back to an arbitrary point in space is no reason to socialize or alter your alcohol intake pattern—you dig out some data and run some simulations.
Your assumptions are as follows:
- 2019 data arguably fits best with the current stage of the market, post-bubble pop and at the same point in the halving cycle.
- You will only trade on a DEX for security, but can discard the effect of gas costs (you've been checking out Ruby and SKALE, you clever sausage).
- Trading fees are a percentage of the total you deploy, so will be the same no matter what, meaning you can also ignore their effect.
- You will spend a total of $5,256 for each simulation, buying with the following amounts of USD at the close of each candle for five different intervals:
- $0.01 per minute
- $0.60 cents per hour
- $14.40 per day
- $101.07692307 per week (it a source of constant frustration to you that a year is not neatly divisible into weeks)
- $438 per month
- Your benchmark for success will be the total value of your investment in BTC at the end of the year (also given for the closing price of bitcoin on December 31, 2019, which was $7,168.36).
A couple of happy hours of data-crunching later, and the results are in:
- $0.01/minute: 0.83856410 BTC, or $6,011.13
- $0.60/hour: 0.83852061 BTC, or $6,010.82
- $14.40/day: 0.83717287 BTC, or $6,001.16
- $101.07692307/week: 0.83422829 BTC, or $5,980.05
- $438/month: 0.83470612 BTC, or $5,983.47
That's a clear win for per-minute DCAing, which provides over 0.5% greater returns than the worst option, weekly buys, though there's very little difference with hourly buys.
Interesting, you think. Very interesting. Shorter intervals appear to be more profitable, as a rule. But that monthly outlier raises a question mark, so you download hourly data and repeat the process for hourly, daily, weekly, and monthly purchases for every year from 2016 to 2022, marking the best option green and the worst red.
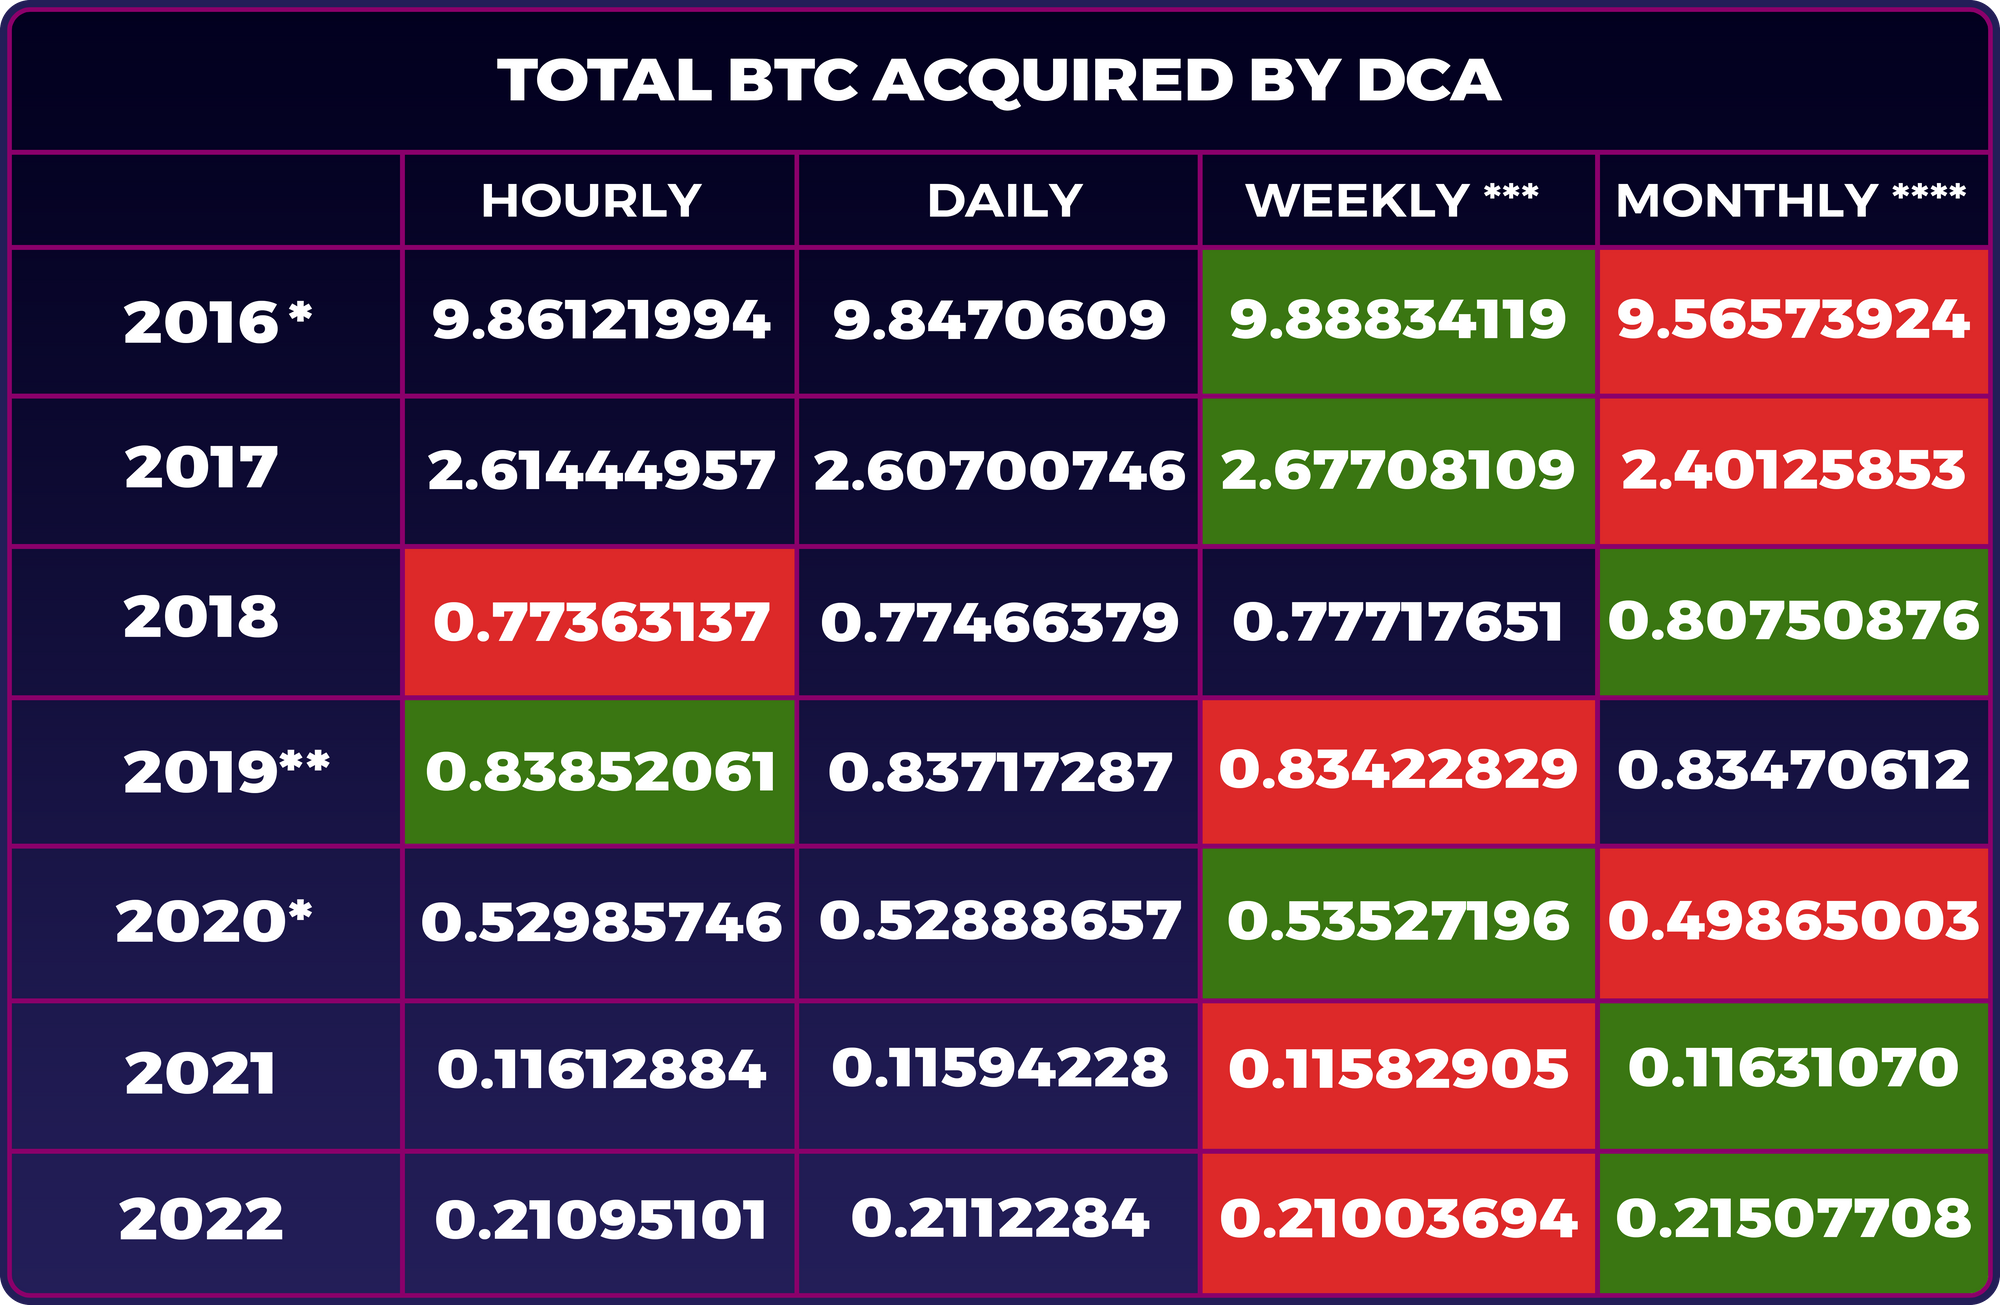
* 2016 and 2020 were leap years, which makes you even more angry than the weeks-per-year problem. Because $14.40 more is spent due to the extra day (bringing the annual total to $5,270.40), you increase the weekly purchase amount to $101.35384615 and the monthly purchase to $439.20 to compensate.
** There are gaps in this dataset for 2019, so you use your previous analysis. This doesn't matter because it's the comparison within years that's important, not between them.
*** Weekly buys are made on the first Sunday of the year, and on 51 subsequent Sundays.
**** Monthly purchases are made on the last day of each month.
Caveats:
- The market's randomness means you should not expect results to be 100% consistent (e.g. variance dictates that hourly DCAs won't always be better than daily, even if they are most of the time).
- The first Sunday occurs at a different point each year. Weekly DCAs are therefore not a fair comparison with hourly and daily ones.
- Months are different lengths, meaning the interval is irregular, forcing you to slow your breathing and go to your Happy Place.
- Any trend over the course of the year has a more predictable effect on monthly DCAs than on shorter intervals. In bear years, it's obviously better to invest as late as possible, hence buying at the end of each month is more profitable, as for 2018 and 2022. (Of course, if you know it's going to be a bear year in advance, you wouldn't DCA in the first place, so this is kind of moot.)
- When there are fewer purchases (e.g. every month) catching one or two outliers, like the June and December crashes for 2021, can make a big difference to the end result. Obviously, this effect cuts both ways and you can end up with less BTC if the market spikes upwards just before you buy.
Insights:
- Hourly and daily DCAs are less likely to perform either best or worst.
- Conversely, weeks and months tend towards one or other extreme: They are likely to perform either best or worst.
- Put another way, shorter time frames slightly reduce risk but also potential return.
- 6 times out of 7, hourly DCAs are better than daily.
- Our system of measuring time is in serious need of overhaul for the 21st century.
Emotionally drained by the arbitrary inconsistencies imposed on you by humans' ridiculous approach to chronology, you decide to try one last experiment.
Forget weeks, forget months. These are the relics of 4,000-year-old Babylonian culture and have no place in a scientific analysis of the cryptocurrency markets. They can, in fact, "Do one".
There is only one way to settle this. You will simulate investments at intervals that are factors of 8,760 hours (a normal year), thus at least ensuring the consistency of ending all investment cycles at the same time (the last hour of the year).
8,760 has 32 factors: 1, 2, 3, 4, 5, 6, 8, 10, 12, 15, 20, 24, 30, 40, 60, 73, 120, 146, 219, 292, 365, 438, 584, 730, 876, 1095, 1460, 1752, 2190, 2920, 4380, and 8760. You will invest a total of $8,760 at each of these intervals ($1 every hour, $2 every second hour, $4 every fourth hour, and so on), once again using 2019 data.


This shows what you might have intuitively assumed at the outset: More frequent buys reduce risk the most, while less frequent buys are increasingly unpredictable and generally worse. While the 60-hour interval (just) happens to be the winner for this particular data set, that's only random noise in an otherwise clear trend: Shorter intervals give more consistently good results.
And while that might have seemed obvious (though worth checking in its own right), you're surprised by the magnitude of the differences. The traditional approach of monthly DCAs is decidedly sub-optimal, and even weekly is problematic, entailing a hit of somewhere in the region of 1%. Since the purpose of DCA is to reduce risk, the way forward is clear.
It's bedtime and under normal circumstances you would wait until tomorrow to set up your DCA. However, someone is selfishly letting off fireworks for some reason, so you can't sleep anyway. You bridge funds to the Europa Chain and select hourly purchases since this, statistically, combines the highest profitability with the least risk.
As you finally drift off to sleep, spreadsheet cells dancing in your mind's eye, you reflect that in an ideal world you might divide the year into 10,000 metric "hours" and invest at a provably random point every hour to mitigate any additional noise.
But it's possible you might be overthinking things.

Check out How To Use Ruby's New DCA feature, and set up regular buys for whatever interval and amount you want!
Follow us on Twitter, join us on Discord, and subscribe to the Ruby blog for regular updates.


